
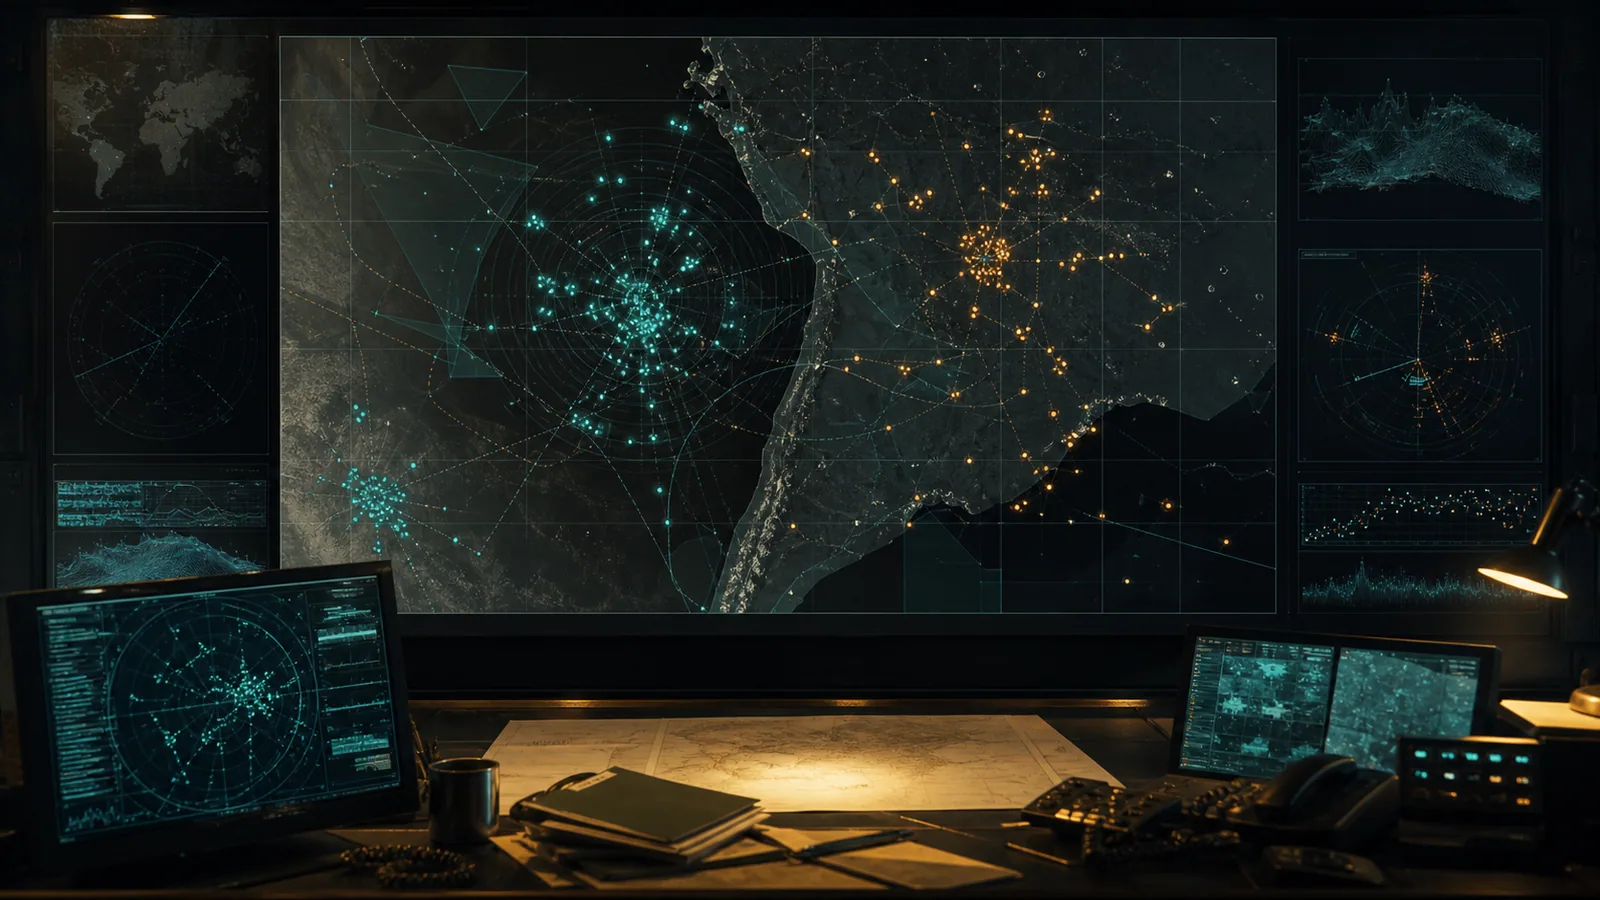
AARO’s public reporting-trends page now covers reports from January 1, 1996 through August 15, 2026. The update adds a useful snapshot of what reaches the office, but the charts describe the reporting system—not the underlying nature of every object.
What the dashboard can establish
The data can show when reports were submitted, where they cluster, which domains are represented, and how witnesses described morphology. Those patterns help analysts identify collection gaps and recurring observation conditions.
What the charts cannot establish
A count of ‘orb’ or ‘triangle’ descriptions is not a count of verified craft. A single event can be reported more than once, categories depend on witness language, and many cases lack the calibrated range, telemetry, weather, and sensor metadata required for identification.
Read trends as collection evidence
The strongest use of this update is operational: compare reporting rates with policy changes, sensor coverage, military activity, satellite visibility, and known aviation traffic. A rise may reflect better reporting rather than more phenomena.
Assessment
High confidence in the official aggregate; limited confidence in origin claims drawn from it. The dashboard is a map of observations received by AARO. It is not a disclosure of exotic technology and should not be treated as one.